Linear function, Definition and examples
This article will be about The main concept of the linear function, how to differentiate these types of functions, with examples.
Definition of a linear function
The linear function is a type of function that has the form f(x) = mx+b or y = mx+b, the characteristic of this function is that the independent variable (x) is raised to the power of 1.
The main characteristic of a linear function is that it has a constant growth in all the function, this means that the range advances at the same velocity all the time.

When we graphic a linear function we get a straight line that has an inclination angle from the x axis, if the function does not have an inclination angle then we would be talking about a constant function instead of a linear function.
A linear function is also known as a lines this referring to the shape of the graphic, that is a straight line, so when we hear about “parallel lines” or “slope of a line”, or anything about “lines”, we must know that is about a linear function.
As we taught before, the form of a linear function is f(x) = mx+b, although the general form of the function is this, it is not necessary that a function is written this way, in this case “b” is any number that could be represented or not in the function, in case that “b” is in the equation of the function, we are going to take as “b” the number in that position, but if there is not a number in the “b” position then “b” would be equals to 0, this also applies to the “m” variable, of which we are going to talk right now.
Slope of a linear function.
The slope of a linear function is represented by the letter “m” and this indicates that the graphic defines the growth of the function, this is not the angle of inclination of the function, this value represents the advance that “y” has for each increment of “x”. The slope of a function can be written as an integer number or as a fraction.

We can see the behavior of the function just by checking the slope “m”, if the slope is an integer number, then that number will represent the advance that “y” will have for every “x” number, for example: if the slope of a function is equals to 4, then for each number that “x” increases, the “y” will increase 4.
In case that the slope is a fraction: m=a/b, then this will behave like this: for each “b” value the “x” increments, “y” will increment “a” values, for example, if the slope of a function is m=2/6, then for each 6 numbers in “x” the function will increase 2 in “y”.
The higher the vale of the slope is, the more inclined the line of the function will be, and the closer the slope is to 0, the flatter the function will be.
The previous sign to the slope also tells us something about the function, if the sign of the slope is negative (-m) then the function will be decreasing, this means that the function will decrease while the “x” values advance, if the sign of the slope is positive (+m or just “m”) then the function will increase when the “x” values increase

Cut of the function with the “y” axis
Another variable we can see in the function is the variable “b”, “b” is the value that is not next to the “x”, in case that there is not a number alone, then the value of “b” is 0. The value of “b” represents the cut with the “y” axis, this means that if “b” is equals to 2, then the function with cut with “y” when “y” is equals to 2, in case that “b” is not in the function then the intersection of the function with the y axis will be in y=0.

Domain and range of a linear functions
Both domain and range of a linear function are the Real numbers, this, represented in intervals would be: ]-∞, +∞[, and this will be in any linear function, no matter if the slope of the function is really high or really low, at the end, this function will point to infinite in both sides.

Examples of a linear function
In real life there are situations where we can appreciate a linear function, like the percentage of charge of a cellphone that is charging, the number of steps a person takes when walking, and like these there is a ton of situations where we can appreciate a linear function, now we are going to show some examples of a linear function.
Example 1: A person is walking in a park to a constant step, and we know that this person is walking 2 meters per second.
A big part of the functions applied in real life problems are written the same way, so the first thing to do is write the function.

The first thing we have to do to write the function is determine which is the independent variable and which is the dependent variable.
In this problem, if we read and analyze it we can see 2 variables, one is the meters the person walks and the other one is the time, In cases where there is the time, we know that this will always be the independent variable, and the rest of the variables are going to change when the time changes, so the meters will depend on the time.
So now that we know that the time is the domain of the function and the meters are going to be the range of the function, we can write the equation.
Like the distance increases in two values when the time increases 1, we can say that the function in this case is f(t) = 2t, where “t” is the time and f(t) is the meters the person walks.
Now that we have the function we can calculate the number of meters the person walks in any number of seconds by just evaluating the function, like this.
- After 1s
- f(1) = 2(1)
- f(1) = 2
- After 3s
- f(3) = 2(3)
- f(3) = 2
- After 6s
- f(6) = 2(6)
- f(6) = 12
- After 10s
- f(10) = 2(10)
- f(10) = 20
Now that we have the function we can graphic the number of meters the person walks in a determined time.

Example 2: A ferris wheel turns 4 times per minute, write the function for this case.
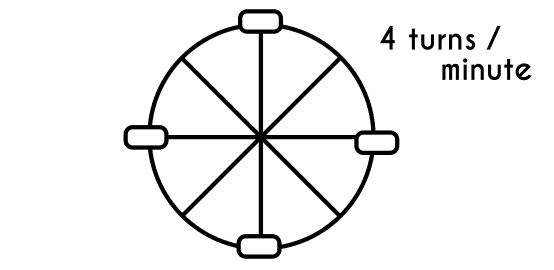
We are going to make this example faster. The independent variable will be the time, the only change is that this time, the time will be in minutes not in seconds, and the turns of the wheel will be the dependent variable.
When we write the function we would have this: f(x) = 4m where “m” represents the minutes and f(m) will be the number of turns of the ferris wheel, when we graphic this function we would have the following graphic.
