Quadratic function, definition, graphic and examples
This article will be about The definition of a quadratic function, with its characteristics, and the parts of the function, with formulas and developed examples.
Quadratic function definition
The quadratic function has the form: f(x) = ax2+bx+c. This type of functions are characterized because the variable “x” is raised to the power of 2.
The quadratic function is characterized because the values of the range are going up and after it passes the center, the range goes down again, or vice versa, depending on the direction of the function. Because of the behavior of the quadratic function, its graphic has a shape of a “u” that is opening more and more every time, and this shape is called parabola.
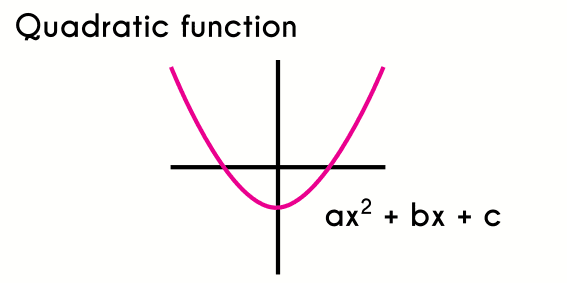
The equation of every quadratic function is formed by 3 parts that are called terms, these terms are the constants “a”, “b” and “c” where “a” will be the number that is multiplying the “x2”, “b” is the term that is multiplying the “x” and “c” will be the number that is alone. Something that applies in each term is that if there is not a number next to the “x2” or “x”, then we understand that the term is equals to 1, because when the value of a term is 1, usually we do not write it, and in case that there is not an “x”, we understand that the value of the term is 0.
For example, if we have the following function f(x) = 6x2+3x, the terms are: a=6, b=3 and c=0, and in the function f(x)=x2+3, the terms of the function are: a=1, b=0 and c=3. Is necessary to learn how to find these term only with seeing the function because by knowing them we can graphic and find the domain and range of an easier way.
Graphic of the quadratic function
The graphic of a quadratic function is characterized because it has the shape of a parabola, this means that the graphic is going down until it reaches the center of the function, and then it goes up again, and vice versa, the function goes up and after it reaches the center, it start to go down again, something we must have clear is that not every parabola is a function, we can only consider as functions the vertical parabolas, (that either open up or down) because the horizontal parabolas are not functions.
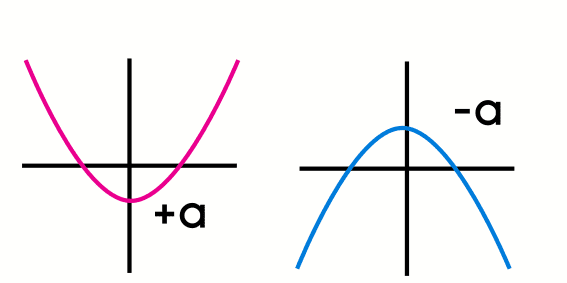
The direction of the quadratic functions will depend on the “a” term, if the “a” term is positive, then the quadratic function will open up otherwise, if the term “a” is negative then the parabola will open down, so we can know the graphic of the function just by looking at the equation.
For example, if we have a function f(x) = 4x2+2, the function will open up, but the function f(x) = -x2 will open down.
Vertex of a quadratic function
The vertex of a quadratic function is the highest point (if the parabola opens down) or the lowest point (if the parabola opens up) of the graphic of the function in the “y” axis. The vertex is also the center of the function in the “x” axis and this divides the function in two parts.
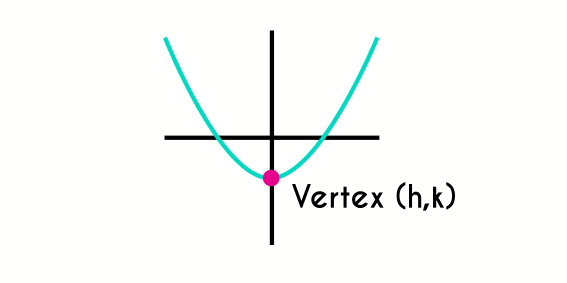
To find the coordinates of the vertex we must know that the coordinates of this are written like this (h,k), where “h” is the coordinate in “x” and “k” is the coordinate in “y”, and these are written with these letters to not confuse them with the variables of the function.
To define the location of the vertex we are going to use formulas that use the terms of the function.
- h = -b2a
- k = f(h)
As we can see in the formulas, to find the coordinate of “k” what we do is evaluate the function in “h”, so first we have to find “h” to just then find the value of “k”.
To demonstrate how to find the vertex of a function we are going to find it in the following function: f(x) = 2x2+4x+3, when we see the function we can observe that the terms of the function are: a=2, b=4 and c=3.
- First we find "h"
- h = -b2a
- h = -(4)2(2)
- h = 44
- h = -1
- Now we find the value of "k"
- k = f(h)
- k = 2(-1)2 + 4(-1) + 3
- k = 2 -4 + 3
- k = 1
- So the coordinates (h,k) of the vertex are in (-1,1)
Domain and range of the quadratic function
The domain of a quadratic function are the reals, in intervals this is ]-∞, +∞[.
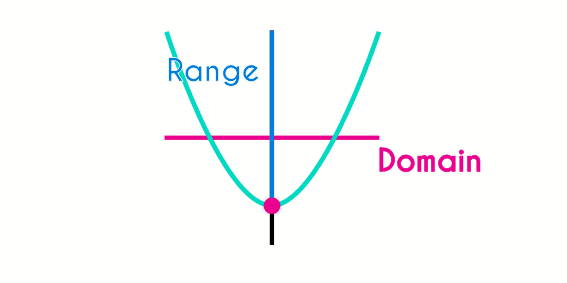
To find the domain and range of a quadratic function the process is a little more complicated, because it is necessary to find the position of the vertex, because depending on the vertex, and the direction of the parabola the domain and range will change.
The vertex is the first important point of the parabola when we want to determine the range of the function, because this is the limit point of the range, this could be either a high limit or a low limit, because the other aspect that defines the range is the direction of the parabola, because if the function opens up, then the range will go from the vertex to plus infinite, but if the function opens down, the range will go from minus infinite to to the position of the vertex.
We are going to take the following example: f(x)=x2+6, in this case the vertex is in (0,6) and the term “a” is positive so the parabola is going to open up, so the range of the function will go from the “k” coordinate of the vertex (6) to plus infinite [6, +∞[.
Examples of the quadratic function
Example 1: a car is completely at rest and will start to accelerate at 4 meters per second, do the function of this example.
To obtain the function of this problem we have to use the formulas of the uniformly accelerated motion, but like this is not the topic of this article, we are not going to inquire more in this, but the function we get is the following f(x)=2x2, once we establish the equation of the function, we can proceed to do the rest.
The first thing we are going to do is find the coordinated of the vertex of the parabola.
- First we find the "x" coordinate of the vertex (h)
- h = -(b)2(a)
- h = -(0)2(2)
- h = 04
- h = 0
- And now the "y" coordinate of the vertex (k)
- k = f(h)
- k = 2(0)2
- k = 0
- The location of the vertex is in (0,0)
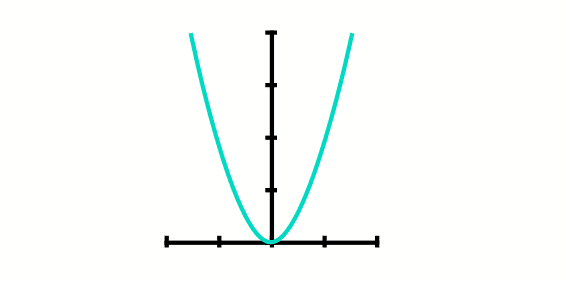
Now that we have the position of the vertex we can determine that the domain of this function are the reals and the range of the function goes from 0 to plus infinite. And when we graphic the function it would be the following way.
Example 2: A colony of ants grows at a velocity of w2+1, where w are the weeks, graphic the growth of the population of the ants from the week 0.
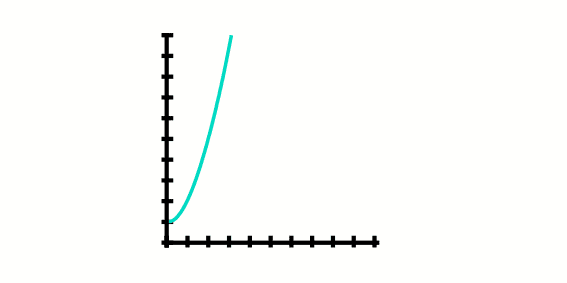
In this case we are not going to graphic the whole parabola, only from the w=0, so the graphic is not going to look like a complete parabola, it is going to be only a part of that.
What we do in this problem Is evaluate a function in the weeks we want to find, in this case from week 0 to 4.
- f(s) = s2 + 1
- In the week 0 (At the begining)
- f(0) = 02 + 1
- f(0) = 1
- In the first week
- f(1) = 12 + 1
- f(1) = 2
- In the second week
- f(2) = 22 + 1
- f(2) = 5
- In the third week
- f(3) = 32 + 1
- f(3) = 10
- In the fourth week
- f(4) = 42 + 1
- f(4) = 17
