Quartiles definition with formulas and examples
This article will be about The definition of quartiles, formula to find them and solved examples step by step.
Definition of quartiles
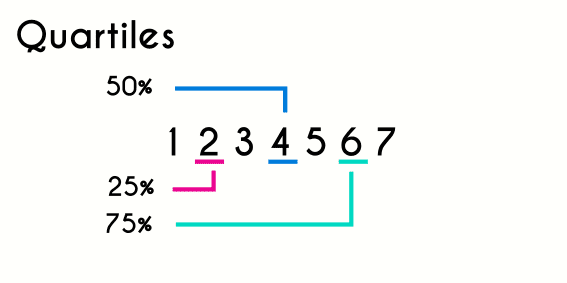
The quartiles are a statistical tool that allows us to divide a series or a set of numbers in 4 equal parts, this way we can classify the numbers in 25%, 50% and 75%. Just as it happens with the standard deviation and the measures of central tendencies, the quartiles help us to have a clearer perspective of the dispersion of the data, but in this case, not based in an average number, but in percentages.
Quartile 1
Quartile 2
Quartile 3
Quartile 4
The quartiles are found when we have the series of data ordered, it means that to find the quartiles of the following series: {9,3,7,5,1,2,4,8}, this would have to be ordered first, either from lower to higher: {1,2,3,4,5,7,8,9}, or from higher to lower: {9,8,7,5,4,3,2,1}. The way we order the series will depend on the purpose of the study and the analyses we are looking for, but both types of order are valid for finding the quartiles.

Los cuartiles se encuentran cuando se tiene una serie ordenada, es decir, que para encontrar los cuartiles en la siguiente serie: {9,3,7,5,1,2,4,8} esta tendría que ser ordenada primero, ya sea de menor a menor: {1,2,3,4,5,7,8,9} o de mayor a menor: {9,8,7,5,4,3,2,1}, el tipo de orden que se le dé a un conjunto de datos va a depender del propósito del estudio y del análisis que se le quiera dar a los datos recopilados, pero cualquiera de los ordenes que se le aplique a una serie de números es valido para encontrar los cuartiles.
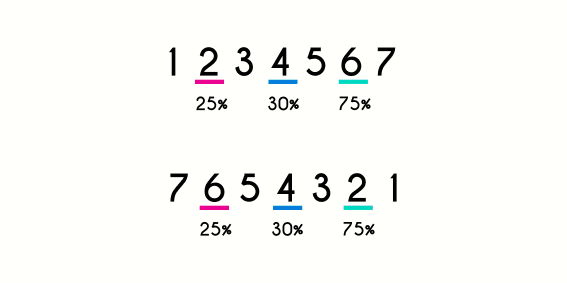
There are some times where to analyze a problem from different perspectives we have to find the quartiles twice, one from higher to lower, and one from lower to higher, but when we find the quartiles in both ways, we are only going to invert the order of the quartiles, the first quartile will now be the third quartile, and the third will now be the first quartile, because the position of this 2 are not going to change, while the second quartile will not change at all.

The quartiles are 3 number that divide the data set in 4 parts, where until the first quartile there is 25% of the data, until the second quartile there is a 50% of the data and until the third quartile there is a 75% of the data.
The second quartile will always coincide with the median, this happens because the second quartile, just as the median, is the number that is in the middle of an ordered series of numbers, and just as with the median, when the total number of data is an odd number, then we are only going to have one middle number, but when the total number of data is even, then we are going to have 2 central numbers, and in these cases we are going to find an average between the middle numbers, and the result will be the second quartile.
Another property about the quartiles is that the first quartile will be in the middle of the first number and the second quartile, and the third quartile will be in the middle of the second quartile and the last number.
Quartile examples
To understand the explained before we will develop the following example: the height of the members of a company was measured (in centimeters), find the quartiles of the results:
The first thing we are going to do is order the numbers from low to high.
Then we are going to find the central number and this will be the second quartile.
After that we have to find the number between the second quartile and the first number and this will be the first quartile.
And last we have to find the number between the second quartile and the last number and it will be the third quartile.
The quartiles allow to be able to analyze the data in percentages, in this case the first quartile is 168, so we can say that 25% of the data is equals or lower to 168, the second quartile is 173, so the 50% of the data is equal or lower than 173, and last, the third quartile is 177, and as the fourth quartile is the 75%, the 75% of the data are equal or lower than 177.
Formula of quartiles
There are cases where we can not find the quartiles only by seeing the data, as we did in the last example, but when the quantity of data is bigger, find the quartiles is much more complex, but for these cases there is a formula to find the position of each quartile.
- Formula
- Qk =
k (n + 1)4
In this formula the letter Q is the quartile and the variable “k” is the number of quartile we want to find, “n” is the total number data (we divide it by 4 because we are finding quartiles).
Examples of quartiles
When the position of the quartile is a decimal there are many ways to take this results, but in this examples we will solve it the next way: if a quartile is a number that is exactly in the middle of 2 numbers (for example 3.5 is in the middle of 3 and 4), then we will make an average between these two numbers, but if we get a decimal that is not in the middle (like 5.25 or 6.75) we would take the closest integer number to it.
Example 1: Find the quartiles of the following series of numbers
First we order them
Now we are going to find the position of every quartile
- We find the fisrt quartile
- Qk =
k (n + 1)4
- Q1 =
1 (9 + 1)4
- Q1 =
104
- Q1 = 2.5
- Now we make an average of the 2nd and 3rd number (1 and 2)
- R =
1 + 22
- R =
32
- R = 1.5
- Now we find the second quartile
- Q2 =
2 (9 + 1)4
- Q2 =
204
- Q2 = 5
- And finally the third quartile
- Q3 =
3 (9 + 1)4
- Q3 =
304
- Q3 = 7.5
- we calculate the average between the 7th and the 8th number
- R =
7 + 82
- R =
152
- R = 7.5
Result
Example 2: Find the quartiles of the following group of numbers
First we order the series
Now we find the 3 quartiles
- First we calculate the 1st quartile
- Qk =
k (n + 1)4
- Q1 =
1 (7 + 1)4
- Q1 =
84
- Q1 = 2
- then the second
- Q2 =
2 (7 + 1)4
- Q2 =
164
- Q2 = 4
- And finally the third
- Q3 =
3 (7 + 1)4
- Q3 =
244
- Q3 = 6
Result
Example 3: Find the quartiles of the following data that was compiled based on the age of the members of a work group
Order the numbers
- We find the quartile 1
- Q1 =
1 (10 + 1)4
- Q1 =
114
- Q1 = 2.75 ⋍ 3
- Then the second quartile
- Q2 =
2 (10 + 1)4
- Q2 =
224
- Q2 = 5.5
- Now we make the average between the 5th and 6th position
- R =
31 + 332
- R =
642
- R = 32
- And last the third quartile
- Q3 =
3 (10 + 1)4
- Q3 =
334
- Q3 = 8.25 ⋍ 8
Result